The autumn half term holidays are a hazard to parents across the UK; the weather is looking a bit grim for a trip to the beach or a picnic, and those giant inflatable warehouses are painful on the eyes, ears and wallet. So this autumn, encouraged by numerousarticlesexpounding the supposedly most haunted places to visit in Greater Manchester, I took my teenager for a day trip to the metropolis formerly known as Granadaland.
Ordsall Hall
Ordsall Hall was also used as a clergy training school, a working men’s club, and a job centre (Credit: Mark Horne)
First up was Ordsall Hall, nestled a stone’s throw from the city centre. As the oldest building in Salford, dating back to 1177, the hall seemed a likely spot for a spooky encounter, and indeed its website boasts of three ghosts: The White Lady, reputed to be the spirit of Tudor Lady Margaret Radclyffe; juvenile spook Cecily, whose presence is indicated by the scent of roses; and Sir John Radclyffe, who lives in the Star Chamber and is a bottom-pinching sex pest to female visitors. We were quite startled to enter one room and find a strong floral smell. I initially speculated that it might be their chosen cleaning product, but further investigation suggested an even more direct reason: bowls of drying rose petals!
Ordsall Hall – claimed to be haunted by a child ghost called Cecily who smells of roses (Credit: Mark Horne)
The hall, operated by Salford Community Leisure, was a pleasant change from the sometimes stuffy approach familiar to those visiting National Trust properties. Two glass panels revealed the interior of the old walls and the rafters, and there were numerous interactive, educational and informative displays with smells, sounds, and even a small art gallery, which we were told was the site of several spooky encounters for one volunteer at the property.
We left delighted and informed, but surprising smells aside, not haunted.
Teenager evaluation: “The staff were really friendly and it had really pretty architecture.”
Spooky rating: 3/10
Visit rating: 9/10
St Ann’s Church
St Ann’s Church – The Haunted Table Tombs (Credit: Mark Horne)
We then made the short drive to Manchester city centre and two religious sites of haunted repute.
St Ann’s Square – these trees were spookier than anything that happened at the haunted church (Credit: Mark Horne)
First up (after an important lunchtime pit-stop for Thai food) was St Ann’s Church, in the picturesque St Ann’s Square. The inside of the church was wholly unremarkable, aside from a free hour-long organ recital, but the real appeal is outside of the church, at the rear by the table tombs, where legend holds that if you walk around them three times anticlockwise – or “widdershins”, and then put your ear to the tomb, you can hear the dead talk. We both tried, and we both heard nothing beyond the general light rumble of the city centre.
Teenager evaluation: “Big pic of King Charles at the door, what an icon. I liked the intricate stained glass windows. The best bit was going around the grave. There were some rubbish roadmen watching us from afar.”
Spooky rating: 2/10
Visit rating: 3/10
Manchester Cathedral
Manchester Cathedral (Credit: Mark Horne)
The city centre took a further knock from our visit to Manchester Cathedral, the walk to which involved a tantalising stroll past the iconic Sinclair’s Oyster Bar. The Cathedral has two ghost legends: the sighting by a worshipper of his sister, who unbeknown to him had died that same time miles away; and a giant demonic dog called Black Shuck. Thankfully nobody we know personally passed away during our visit, so the first option was out, and Black Shuck was apparently exorcised some years back, which possibly explains the absence of the sinister hell-hound.
The best bit of Manchester Cathrdral – the ever-present bee (Credit: Mark Horne)
The 600-year-old Cathedral itself was renovated in Victorian times, then extensively restored after the Manchester Blitz in 1940, and further damaged in the 1996 IRA bomb. Like St Ann’s Church, the Cathedral was also engaged in organ-based business when we visited, but rather than a pleasant recital there seemed to be some kind of ear-splitting tinnitus-like sound test taking place, so we did not linger.
Teenager evaluation: “Kind of boring, kind of basic, kind of ugly. Didn’t even have actual pews, just like year 4 classroom seats. The stained glass windows are better from the outside.”
Spooky rating: 0/10
Visit rating: 1/10
Boggart Hole Clough
Boggart Hole Clough – The pictures doesn’t really do its spooky atmosphere justice (Credit: Mark Horne)
A change was needed, so we ventured north to Boggart Hole Clough, an impressive urban park in Blackley. As the name suggests, the park is reputed to be home to the boggart, a malevolent creature from English folklore that in the North West is said to “live outdoors, in marshland, holes in the ground, under bridges and on dangerous sharp bends on roads.”
We stopped at the apocalyptically uninviting visitors centre car park and went boggart-hunting, and although our trip over bridges, up snaking stairs, through woods and over fields did not yield a single mischievous monster, the often-grey Manchester light was beginning to fade and the cries of birds created quite an ambience for our walk.
Teenager evaluation: “The crows were quite spooky and the bridges and muddy holes… the overall atmosphere made me feel quite uneasy.”
Spooky rating: 5/10
Visit rating: 7/10
Ring O’Bells
The Ring O Bells – Any Spirits? No thanks, just a pint of mild (Credit: Mark Horne)
The final destination was the lovely Ring O’Bells pub in nearby Middleton. Apparently built on a former druid temple, there’s been a pub on the site – at the top of a hill and adjacent to St Leonard’s parish church – since the 12th Century.
Over the last 900 years, it is said to have been the location of a civil war massacre and the home of Sweeney-Todd-esque serial killer landlords in the 1600s. Thankfully the current bar staff seemed entirely benevolent – children even welcome until 7pm! – and although there was a strange display of ornamental sticks on the ceiling, and curious photographs of ancient scout troops on the walls, we found no sign of any of the numerous ghostly legends in our short stop before home-time.
Teenager evaluation: “It’s a friendly pub.”
Spooky rating: 2/10
Visit rating: 9/10
Overall impression
Would my young accomplice recommend a trip to Manchester for a spooky half-term ghost hunt overall?
It seems a bit unfair on Manchester to judge it on that basis, since ghosts don’t exist. But we had a fun day.
“THE WHITE RACE IS BEING REPLACED! WE ARE BEING REPLACED!”
These were the first words I heard on Saturday 30th September 2023 as I wandered into Glasgow’s George Square. They were being launched into a loudhailer (or loud-heil-er?) by a member of the afore-shouted race. It’s not quite what I expected from a protest about traffic restrictions, but it turns out that there were to be plenty of other noxious emissions unrelated to the topic du jour in the city centre that day.
The Great Replacement scaremongerer wasn’t one of the official speakers, but he claims to have been given permission to speak (well, shout), and had procured his makeshift amplification from one of the organisers. Some of the gathering crowd didn’t seem happy with the outburst, but others nodded along.
As I waited for things to kick off, I scanned the crowd. Middle aged white men seemed to be in the majority, so I fitted right in without any requirement for disguise. I spotted a ‘God’s Children Are Not For Sale’ t-shirt as well; a tip of the hat to QAnon-adjacent child-trafficking fantasy fiction movie ‘The Sound of Freedom’, which has been widely criticised for inaccuracies and fabrications. Not a great start to proceedings.
The sound of free-dumb
The purported reason for the day’s protest was Glasgow City Council’s implementation of a Low Emission Zone in the city centre. The legislation aims to prevent the most polluting vehicles from entering the most congested areas of the city, and imposes a fine for doing so. At the surface level it’s a common-sense measure to try to prevent the obvious health implications caused by busy traffic in a highly populated area.
It’s not a perfect plan of course; the noble intentions come with legitimate concerns that small businesses and people of lower socioeconomic status are likely to own the older vehicles which fall foul of such regulations. As with many things, the risk/benefit analysis is crucial. There seems to be reasonable evidence of the health benefits, which should be enough to negate the downsides, but it doesn’t take long for the mask to slip and show that the majority of speakers and protesters are only using those legitimate concerns as a springboard into much murkier, conspiratorial territory.
Low congestion area
Talking of masks, the theme of ‘highway robbery’ is prematurely flogged to death by a lady who has beaten the Halloween rush to an outlaw costume. She dances somewhat unconvincingly to ‘Stand and Deliver’ while theatrically waving her anti-LEZ placard. It is however good enough to draw the attention of the somewhat meagre crowd before the speakers commence.
Or at least, it would have been if the speakers had started immediately after. It turns out we still had another fifteen minutes to wait. The DJ expertly fills the void by playing Madness classic ‘Driving in my Car’. He is later heard asking bystanders for “other songs about cars” that he could play. Slick.
The speaking area consists of what appears to be a gazebo from Argos with a low-budget PA setup (feedback, echoing, and complete-audio-drops aplenty). A poster about Fifteen Minute Cities at the back of the gazebo is a further sign that this isn’t really going to be just a protest about emission control.
Madam and the rants
Finally, with minimal fanfare our first speaker finally takes centre stage (well, gazebo): David Icke-alike Paddy Hogg. His face looks familiar to me but I can’t quite place it, so I send a picture to my editor Michael Marshall, who confirms that Hogg was one of the loudest voices amongst the cacophony of hecklers at Marsh’s talk for Glasgow Skeptics about the White Rose anti-vaxx conspiracy theory ecosystem.
Since then he’s clearly gone fully down the rabbit hole as he works his way through a veritable greatest-hits of conspiracy theories: The Scottish government is implementing what they’re told to do by globalist dictators, social and economic engineering, fifteen minute city oppression, we weren’t allowed to question Covid or lockdowns, climate change denial (“The science is not settled”), the “mainstream media”, George Soros is funding Extinction Rebellion, excess deaths caused by the Covid Jab, the PCR test is not reliable, and closing out with a final ramble towards about whether viruses even exist, he advises the crowd to look up Terrain Theory (a discredited fringe belief from over a century ago). Exhausting stuff!
Colin into question
Unexpectedly, the next speaker is the most disappointing. There’s the makings of a genuine story here. Colin McInnes is an award-winning founder member of Homeless Project Scotland. They do amazing work. I’ve seen their van in the city centre myself, helping the most vulnerable throughout the year. That refrigerated van is, however, the root of their problem, as it falls foul of the new guidelines. An appeal to Glasgow City Council for an exemption failed, which presumably fuelled the ire of McInnes.
As a result he seems apparently willing to be the vaguely rational meat in an otherwise conspiratorial sandwich. He says he’s less skeptical than the previous speaker about global warming, but “that’s fine” (it’s not by the way). He also says he’s a scientist, although I could find nothing to corroborate that. More strangely though, he says little or nothing about the plight of his charity, but spends more time talking about MOTs and vehicle emission standards.
McInnes’ speech ends with more sinister tones though: “They just want to install systems of control. They want to spy on you and your children”. It seems as though he may possibly be in the process of being radicalised by the somewhat questionable company he’s keeping – perhaps notable, given the fundraiser they kicked off for a new van reached and exceeded its target three months ago.
Piers pressure
The headline act of the day is the Daniel Baldwin of political discourse, Piers Corbyn. He rumbles into George Square in a theatrically battered old car festooned with anti-LEZ posters, then shuffles over to the gazebo sporting his trademark dishevelled look. His speech is pretty much the same as many of his speeches from the last few years, and he complements the first speaker’s assortment of tirades to tick off pretty much everything on the conspiracy theory bingo card: The World Economic Forum are trying to bring in a new generation of compliant people and Keir Starmer will be their puppet; Low Emission Zones are here to control you; directed energy weapons; they want to charge you up to £1500 if you don’t install double glazing; man-made climate change does not exist; carbon dioxide is the gas of life and we want more of it; ‘they’ want to get rid of all cars and planes; eventually they want us all stuck in the one place – it’s part of the fifteen minute city agenda; and so on.
Corbyn also claimed that the Clean Air Zone scheme in Birmingham had been scrapped – it has not, although there are of course many cases of people failing to pay the fine. His own story of non-payment is met with glee by the crowd. In an attempt to customise his speech for the Scottish audience he refers to Nicola Sturgeon, presumably not being aware she is no longer in power.
Tin foil: Not just for hats
There’s a side note of transphobia as we get near the end of the road (“Men are men and women are women. We’re against the sexualisation of children”), and then it’s all over. All that’s left is for a request for donations, after which Piers and his sidekick work their way through the crowd, with Piers himself using what appears to be a takeaway container wrapped in tin foil with “STOP the Great Reset“ sellotaped to it, while standing next to a fully grown adult inexplicably holding a child’s toy sword.
Equally inexplicably, someone else attempts to speak after the Corbyn show. He’s wearing a t-shirt with various quotes on it, including George Orwell (predictably), and such luminaries as Jordan Peterson, and Julian Assange. He’s strawmanning electric car technology, complaining about cycle lanes, and asking people to upload any videos they’ve taken to rumble.com because they “believe in free speech”. Nobody’s really listening much at this point though, including me, as I’m busy trying to dodge the Corbyn and henchman donation drive that’s making its way through the crowd.
To avoid the shaking bucket takeaway container I decide to start a conversation with one of the most ‘interesting’ looking crowd members. She’s got a LOT of large placards, all laminated, all crammed with the worst of conspiracy theories and pseudoscience. She kindly lays them all out for me so that I can get pictures of them (a small selection are shown below).
Our conversation heads in the direction of old favourite – glyphosate. She says it is very harmful, and has been used on crops in Scotland for over four decades now. I ask her if it’s so dangerous then why has life expectancy been increasing all of that time? A long awkward silence ensues, after which she tells me a website to check out. I make my excuses and head off home to gather my thoughts.
There was certainly something harmful in the air that day in Glasgow, but it wasn’t coming from the vehicles. My only consolation is that not too many people were there to ingest it, and of those who were, most had apparently already overdosed on it.
For months Andrew Bridgen MP, the red-pilled former Tory independent turned sole member of parliament for Lawrence Fox’s Reclaim UK, has been calling for a debate in parliament over the number of excess deaths in England and Wales since the start of the pandemic – or more accurately, given Bridgen’s many public proclamations, since the start of the COVID-19 vaccine rollout.
That said, had the room been full to capacity, with every MP present, how much of a debate would have been had is questionable, given that this 30-minute debate consisted of Bridgen giving an opening statement that lasted for almost 25 minutes.
In it, he claimed:
There will be a full press pack going out to all media outlets following my speech, with all the evidence to back up all the claims I will make, but I do not doubt that there will be no mention of it in the mainstream media.
We have experienced more excess deaths since July 2021 than in the whole of 2020.
Here, HART provides evidence, pointing out that there were 69,293 excess deaths from March to December 2020, but then from July 2021 to September 2023, there have been 76,554 excess deaths. This does actually appear to be right… but it is also an astonishingly misleading way of presenting those particular figures. March to December 2020 is ten months, giving an average excess death per month of 6,929. By comparison, July 2021 to September 2023 is a period of twenty-seven months, averaging 2,846 excess deaths per month – which is less than half of the excess mortality of the previous period. In essence, Bridgen’s point amounts to “isn’t it weird that there were fewer excess deaths in a period of ten months than there were in a period nearly three times as long”. No, that’s not weird.
The other way this is misleading is in what it misses out: Bridgen specifically cited March to December 2020, and then July 2021 to September 2023. That omission can’t help but feel like an act of cherry-picking, and could be a sign of packaging up the data to form the most damning picture possible. To present the data more fairly, we can group the excess deaths by year:
Year
Excess
Average per month
Last 10 months of 2020
69,293
6,929
2021
44,548
3,712
2022
30,614
2,551
First 9 months of 2023
23,301
2,589
Once we do that, the figures are clearly far less indicative of a growing problem than Bridgen characterised. So, let’s have that debate about excess deaths, Andrew: from the full ONS data, we’ve seen a huge fall since 2020’s excess deaths, and now we’re settling at around an excess of 2,500 per month. Bearing in mind, too, that Covid is still very much around.
That covers the first fifteen words of his four-thousand-word speech. This could be a long exercise. He continued:
Unlike during the pandemic, however, those deaths are not disproportionately of the old. In other words, the excess deaths are striking down people in the prime of life, but no one seems to care.
Is it true that the excess deaths shifted from “disproportionately of the old” in 2020, to “people in the prime of life” in 2023? Helpfully, HART provide screenshots of ONS data for this too, though their by-year snapshots don’t make comparisons across years particularly easy (see 2020-21, 2021-22, and 2023).
To solve this, we can collate just the excess deaths column into a table summarising by year and by age group. Even then, doing so could make these data seem worrying. For example, in 2020, 73% of excess deaths were in people 75 or above, but this dropped to just 53% of excess deaths in 2023. Meanwhile, 13% of excess deaths in 2020 were in people aged 25-64 – arguably “the prime of life”, from Bridgen’s emotive rhetoric – whereas that number leaps to 29% by 2023. That’s a huge leap in relative percentages.
Age group
2020
2021
2022
2023
All
70727
44548
30614
23001
0-24
-0.60%
0.25%
1.10%
1.79%
25-49
2.38%
6.17%
4.73%
6.52%
50-64
10.58%
22.25%
19.74%
22.95%
65-74
14.31%
21.07%
15.81%
15.40%
75-84
31.36%
26.69%
24.07%
22.99%
85+
41.97%
23.58%
34.52%
30.24%
However, relative percentage figures can be misleading, especially given that what they were a percentage of – the total number of excess deaths – dropped significantly across those years. 13% of 70,000 excess deaths in 2020 is much higher than 29% of the 23,000 excess deaths in 2023.
Looking at the numbers in real terms gives a clearer picture: 51,863 additional people over the age of 75 died in 2020, compared to just 12,244 in that age bracket in 2023; for people aged 25-64, excess deaths in 2020 came to 9,162 and in 2023 it actually fell to 6,778. Excess deaths fell in the “prime of their lives” age group too, but just not as quickly as in the older group – partly because the older group was falling from a higher total, partly because lots of people in that older group had already died over the previous three years, and partly because the vaccine actually works and was protecting them from severe Covid cases.
Age group
2020
2021
2022
2023
All
70727
44548
30614
23001
0-24
-423
113
337
412
25-49
1682
2750
1448
1500
50-64
7480
9913
6044
5278
65-74
10124
9388
4841
3543
75-84
22182
11888
7370
5289
85+
29681
10506
10568
6955
The numbers are even clearer when you look not at excess deaths but the actual numbers of people who died and whose death certificates included the word “Covid”. In 2020, 57,308 people aged 75 or above died with Covid on the death certificate, and so far in 2023 that’s just 10,575 – that’s not excess deaths, to be clear, that’s all Covid deaths. That number is still quite high, to be clear – we still lose around 1100 people per month across all ages to Covid – but much lower than it was. In 2020, 1,458 people aged under 50 died with Covid on their death certificate, and so far this year that number is just 235.
Age group
2020
2021
2022
2023
All
76632
76130
32349
13365
0-24
52
124
97
32
25-49
1406
2465
792
203
50-64
6360
8904
2499
842
65-74
11506
12957
4489
1713
75-84
25038
22367
9585
4219
85+
32270
29313
14887
6356
So, are we really seeing an epidemic among people “in the prime of their life”? Or are we witnessing an MP and a biased lobby group wildly cherry pick and distort data to tell the story they want to tell? We are now 50 words into this 4,000 word speech, but the picture is already quite clear.
Bridgen carried on, lamenting that he was the only one who cares about this issue, and how he has tried time and again to get this topic raised to the house floor, only to be rejected, even though “nothing could be more serious than this topic”. But nothing could be more unserious than the manner in which he, or whoever has prepared this data pack for him, have approached the statistics here – this is the antithesis of serious scholarship or honest research, and it does a disservice to the democratic process to see these convoluted stats aired in the chamber.
Bridgen continued to his next piece of evidence:
Numerous countries are currently gripped by a period of unexpected mortality, and no-one wants to talk about it. It is quite normal for death numbers to fluctuate up and down by chance alone but what we are seeing here is a pattern repeated across countries, and the rise has not let up.
HART kindly refer to a heat map showing the relative mortality for a range of countries, quarter by quarter, based on the baselines expected deaths for that region, and it looks daming, in that it’s lit up red with the many countries that are above their baseline, some very significantly so. But looking at their chart, the countries listed are, in order: Singapore, Qatar, Thailand, Chile, Japan, Puerto Rico, Taiwan, Scotland, England, and Wales, South Korea, Ireland, Finland, Oman, Ecuador, Egypt, Norway, New Zealand, South Africa, Sweden, Brazil, Netherlands, Australia.
To understand the value of this data, we might question that list. Why would an analysis of excess mortality by country lead with Singapore, Qatar, Thailand, Chile? The answer is that the list has been sorted by the countries with the highest exess mortality percentage in Q2 of 2023 – an ordering you would only choose if you wanted to maximise the most worrying possible interpretation of the data.
For a more reflective picture, we can go to the source of the data – a website called Mortality Watch. It’s not a site I was aware of previously, but let’s assume that its information is legitimate, as we’ve no reason to believe otherwise. A dishonest and trite way to rebuff Bridgen’s data would be to simply reverse the filter, and cite the same list ordered by countries with the most positive Q2 2023 first. Do that, and suddenly the picture looks so much healthier: there was an intensely bad period during 2021 and 2022 (perhaps related to the world being in the grip of a deadly and highly transmissible virus), but 2023 tells a picture of a calming, blue 2023 of mortality below the expected rates, dominated by Cyprus, Greenland, Georgia, Romania, Bosnia and Herzogovina, Serbia and Bulgaria.
Of course, this would be to commit the same data manipulation as Andrew Bridgen (or whoever prepared this data for him, if it was not him), and would be equally dishonest an exercise. Instead, we can put the data into alphabetical order, and try to get a global or holistic picture. We can also remove the countries for whom no 2023 data is available, as the absence of up to date data could throw out any analysis. Doing so, we have full data for 80 countries.
There is an initial confounding issue here: sourcing, and ensuring we are comparing apples to apples. Is the way excess mortality is worked out in England and Wales the same as how it’s worked out in Qatar, or Cyprus? Because if the methodology differs, the end result could result in entirely inappropriate conclusions (think, for example, about the myth of Sweden being the “rape capital of Europe”, which was driven entirely by Sweden choosing to record sex crimes at a more granular level than in other countries). We have no easy way of interrogating the excess mortality methodology of each country in this list, so we should avoid drawing too strong a conclusion from it.
Still, there is some indicative use for this data. As Bridgen himself said:
It is quite normal for death numbers to fluctuate up and down by chance alone
In any given period, some countries are going to be above or below their regular mortality figures. Perhaps a natural disaster, war or disease outbreak will end up recording far more deaths than expected. Perhaps after that happens, there might be a period where there are fewer deaths – because the people who were most vulnerable died off during the period of increased risk. Or maybe it’s just an unlucky period of time, in which there are more cancers and heart attackes than expected, by variation alone. Data is messy and noisy.
One, imperfect but indicative way of clearing out some of that noise is to look at very large datasets, where the effect of random chance will be diminshed. If we work out a global average of all countries’ excess death variance in each quarter, we might get a sense for whether this is regular noise, or whether there is something else at play (Bridgen’s hypothesis being that the mass vaccination program has led to an untold number of excess deaths).
If the variance was random, we might expect to see roughly as many countries above their baseline as below, very broadly speaking; anything that varied from that significantly could be suggestive that something else is at play (this isn’t perfect, of course, as it means a lower variance percentage for a small country could cancel out a higher variance percentage for a large country, obscuring a large real number of deaths along the way, but as an excerise it is handy if not conclusive).
Peforming that average across the 80 countries for which we have full data, there is a heavy excess mortality throughout late 2020 and 2021, as the virus took hold and wreaked havoc, with an average additional 20% deaths. However, the first quarter of 2023 saw just 4% additional excess deaths at a global level, and by the second quarter that number had fallen to just 1% additional excess deaths:
Period
Average global variance
2020 Q1
0%
2020 Q2
8%
2020 Q3
10%
2020 Q4
24%
2021 Q1
16%
2021 Q2
18%
2021 Q3
20%
2021 Q4
23%
2022 Q1
16%
2022 Q2
6%
2022 Q3
10%
2022 Q4
9%
2023 Q1
4%
2023 Q2
1%
All this is, of course, while Covid is still around: as we’ve seen, in the UK there are still around 1,100 Covid-related deaths per month. Some of those people may have died due to their other conditions while also having Covid, and some of those people might have been likely to die during the period anyway. Regardless, what is clear is that there is simply no evidence for the kind of substantial uplift in excess deaths that Andrew Bridgen and his supporters at HART were in parliament claiming.
Continuing to analyse Bridgen’s speech by this point, and after a short sidetrack (prompted by a brief, supportive interjection from Shipley’s Conservative Philip Davis MP) to accuse the media of having let the public down badly, Bridgen explained:
One might think that a debate about excess deaths would be full of numbers, but this speech does not contain many numbers, because most of the important numbers are being kept hidden. Other data has been oddly presented in a distorted way, and concerned people seeking to highlight important findings and ask questions have found themselves inexplicably under attack.
It is hard to see this as anything other than breathtaking hypocrisy from Bridgen, to accuse the official sources of data of being “oddly presented in a distorted way”, given the statisitcal orgami he has so far presented in this speech alone. He’s relatively right that his speech won’t contain many more numbers from this point, but I’d argue that’s because, quite simply, the data does not support his claims, and it would not be in his interest to cite it.
The next statistical claim that Bridgen made was:
There were nearly two extra deaths a day in the second half of 2021 among 15 to 19-year-old males, but potentially even more if those referred to the coroner were fully included.
Again HART provide a graph to back up Bridgen’s statement – this time the source is a graph on their own website, which looks at ONS data.
Yet, HART’s own analysis explains:
Cumulative total deaths in young males have stopped deviating from the 2015/2019 baseline and have been running parallel with it.
Which is to say, if there was something going on among this cohort, it has not continued.
However, it is also worth bearing in mind that, from Bridgen’s own formation, he is talking about a cohort consisting of a 5-year age range – which in itself is a small chunk of the 0-24 age band in the ONS grouping. Of which he has split further by gender, to only look at males. Of which he has subdivided by six month periods, to only look at the latter half of 2021. And of all that, the variance is, cumulatively, less than 300 excess deaths. Is this really proof that the COVID-19 vaccine is disproportionally killing young men aged 15-19? Or is it simply an illustration of the principle that data is noisy, and that the more you subdivide it into smaller and smaller sub-categories along more and more axes, the more likely you are to find anomalies and outliers? By HART’s own analysis, the data has regressed to the mean – which suggests it is far more likely a data artifact than a real effect.
Bridgen went on to say that the ONS had been asked to explain this apparent rise in deaths among teenage boys in that six month period, and responded to say “more work could be undertaken to examine mortality rates of young people in 2021”, to which Bridgen indignantley asked:
How many more extra deaths in 15 to 19-year-olds will it take to trigger such work? Surely the ONS should be desperately keen to investigate deaths in young men.
To answer Bridgen here, according to the data he himself is citing, there weren’t any further extra deaths that might trigger such work.
Bridgen next jumped to older people, highlighting that deaths from dementia and Alzheimer’s show a period of high mortality “coinciding with covid and lockdowns” – a telling statement in itself, as it appears to imply that, for Bridgen, both the deadly virus and the measures taken to protect from the virus were equally deadly, a fact that is just not remotely supported by the evidence. But Bridgen rightly highlights that since then, we’ve seen fewer deaths than expected, because “you can’t die twice”. If the most vulnerable patients died in 2020, there are fewer extremely vulnerable patients in 2021.
Bridgen then carried on to make a claim that’s worth quoting at length:
Even for the over-85-year-olds, according to the Office for Health Improvement and Disparities, there were 8,000 excess deaths—4% above the expected levels—for the 12 months starting in July 2020. That includes all of the autumn 2020 wave of covid when we had tiering and the second lockdown and all of the first covid winter. However, for the year starting July 2022, there were more than 18,000 excess deaths in this age group—9% above expected levels.
There were just over 14,000 excess deaths in the under 65-year-olds before vaccination from April 2020 to the end of March 2021. However, since that time, there have been more than 21,000 excess deaths.
Once again, this is the statistical sleight of hand of the shifting time period – for one age group, we compare the twelve months from July 2020 to the twelve months from July 2022 (inviting the question: why start either period at July, if not to skew the data?). For the younger age group, we’re invited to compare the twelve month period from April 2020 to a 30 months period from March 2021.
But, of course, these deaths were already included in the ONS data we’ve previously analysed, and so we can go back to the summary with the statistical chicanery removed, and remind ourselves that exess deaths have clearly fallen from year to year, including across those categories:
Age group
2020
2021
2022
2023
All
70727
44548
30614
23001
0-24
-423
113
337
412
25-49
1682
2750
1448
1500
50-64
7480
9913
6044
5278
65-74
10124
9388
4841
3543
75-84
22182
11888
7370
5289
85+
29681
10506
10568
6955
We could continue, and examine the remainder of Bridgen’s speech, given that we’ve barely made it through the first third, but to do so seems futile. What we’ve seen so far has been example after example of Bridgen allowing his pre-existing biases to colour his interpretation of the data, until he’s skewing and twisting it in quite extraordinary ways in order to make it sing the tune he wants to hear.
So when, next, he turns to ambulance data, and points out that there’s a rise in call outs for the most life-threatening of emergencies, why should we follow his innuendo that the cause is COVID-19 vaccines? Rather than, perhaps, continuing health issues as a result of Covid, or Long Covid, or the rising GP wait times which could lead to people requiring emergency care for untreated conditions?
Similarly, when Bridgen cites the rising figures of people on longterm sickness over the last few years, why should we follow him when he makes the connection to the vaccine rollout:
Claims for personal independence payments from people who have developed a disability and cannot work rocketed with the vaccine roll-out and have continued to rise ever since.
Why should we trust Bridgen’s analysis here, and trust that he’s considered and fairly ruled out the impact of Covid-caused disability, or any other confounding factors that could have arisen from an underfunded and stretched helathcare system? Especially given that he has already shown us, throughout this speech, that he struggles to present any data fairly and accurately?
Bridgen lamented that this debate was such a long time in coming, and then when it came, fewer than a dozen MPs attended it. Once it finally arrived, his 30 minute debate saw him give a 25 minute pre-prepared monologue, leaving just 5 minutes for anyone who disagreed with him at all. That is not a debate, and it is little wonder that the chamber was empty – it is also little wonder that the public gallery was full of Bridgen’s supporters, who could be heard cheering loudly as Bridgen told them what they wanted to hear, regardless of how distorted the data had to be to do so.
With all the time Andrew Bridgen MP had to prepare for this spectacle, it’s a shame he spent so much of it writing a speech that painted himself as a brave, lone crusader, and spent so little time actually interrogating his statistics and checking his facts.
If he truly felt like this was an important topic of discussion, it’s a shame honest discussion seems to have been the last thing on his mind.
John Harvey Kellogg was born in 1852 and grew up in Battle Creek, USA. He was the son of devoted Seventh-Day Adventists, a faith that he later adopted to the full. The young Kellogg soon developed a keen interest in medicine and health and, in 1872, he began to study at the ‘Hygieo-Therapeutic College’, a private medical school focusing on water cures and ‘hygienic therapy’. Just five months later, Kellogg enrolled at the University of Michigan Medical School and then at the Bellevue Hospital Medical College in New York, where he graduated in 1875. Kellogg’s devotion to natural cures was dominant early on; already as a medical student, he became the Editor of ‘Health Reformer’, a journal that later changed its name to ‘Good Health’.
Fresh from medical school, in 1876, Kellogg became the medical director of a 20-bed reform institution run by the Adventists. By the turn of the century, he had renamed it the ‘Battle Creek Sanatorium’ and enlarged its capacity to accommodate 1,200 patients.
Soon, Kellogg had become a household name in the USA, and his patients included many prominent industrialists and politicians. To Feed them, Kellogg and his family had invented not just his now famous corn flakes but also a variety of other foods, including peanut butter, artificial milk made from soybeans, and a range of imitation meats.
Synthesising his Adventist beliefs with his medical assumptions, Kellogg created his idea of “biologic living”, i.e. the idea that a healthy diet, combined with exercise, and recreation was required in order to maintain a healthy body, mind, and soul. In his view, biologic living would protect health effectively and even render vaccinations unnecessary.
Kellogg’s business was booming, and profits initially went to the ‘Race Betterment Foundation’, which Kellogg had created in 1914 for the promotion of eugenics. Kellogg wanted to arrange human reproduction to increase the occurrence of heritable characteristics that he regarded as desirable (Fee & Brown, 2002).The foundation organised three conferences; a fourth meeting was planned but was interrupted by World War II. Due to the news about the Nazi Germany’s Holocaust, the appetite for further gatherings subsided.
In the sanatorium, everyone had to adhere to a strict focus on diet and life style which were meant to cure a person of practically all ills, leading to a kind of purity of the soul. Meat and spicy foods as well as alcohol were thought to overexcite the mind and lead to sinful behaviour.
‘Light bath’, baths under the sun or artificial light lasting hours or even days
X-ray therapy
Regular exercise
Various forms of electrotherapy
Vibrational therapy
Electrotherapy
Massage therapy
Breathing techniques
Colonic irrigation delivered by specially designed machines that could deliver 14 litters of water followed by a pint of yogurt, half of which was to be eaten, while the other half would be delivered via a second enema
Water cures of various types
Kellogg was also obsessed with sexual abstinence, including various measures to avoid masturbation. For boys, Kellogg recommended circumcision without anaesthetic, arguing that the trauma would curb any sexual desires. If circumcision did not suffice, he advised sewing the foreskin shut to prevent erections. For girls, he applied carbolic acid to the clitoris as ‘an excellent means of allaying the abnormal excitement.’
Much of what Kellogg did and advocated had an undertone of salvation. The language of changing the body and communing with the divine combined into the practice of natural healing through God’s creation. Kellogg embraced the notion that God could touch humanity through nature.‘Biologic living’ was centred around purity, not merely of the soul but racial purity too. Meat and alcohol were not just bad, they were considered ‘race poisons’.
Kellogg warned of the peril of ‘race suicide’, a term that summed up the fear of white Americans, namely that their racial purity would be eroded and disappear into ‘inferior races’. He also helped implement a law whereby genetically ‘inferior’ humans such as people with epilepsy or people with learning disabilities could be sterilised. Michigan’s forced sterilisation law, in which Kellogg had a hand, was only repealed in 1974.
Kellogg died on December 14, 1943, in Battle Creek where he is also buried. In his will, he left his entire estate to the above-mentioned Race Betterment Foundation.
And what about Kellogg’s claim to fame, the corn flakes? Are they as marvellous and healthy as Kellogg and his followers made them out to be? The short answer is no. They are boring and full of sugar and starch. Crucially, there are many better options for a healthy breakfast. Try eating more whole grains, fruits, oats, yoghurt, and make sure your diet is balanced.
References:
Fee, E., & Brown, T. M. (2002). John Harvey Kellogg, MD: health reformer and antismoking crusader. American journal of public health, 92(6), 935.
Skepticism is usually associated with the west, not with Africa or Africans. Western anthropologists, colonialists and missionaries introduced Africa as we largely know it today to the world. But that introduction was impaired. It was defective. Western interpretation of African culture is one sided and stereotypic. Western scholars explained Africa in religious, dogmatic, magical and occult terms. They presented Africans as primitive in thinking and outlook.
Westerners have interpreted African cultures in ways that created the impression that scientific or skeptical rationality had no place in the African thought and culture. They westernised scientific outlook and Africanised magical thinking. This mistaken impression, or scholarised racism, which many African intellectuals have been reluctant to challenge, pervades and persists. The stereotypic image of a magical Africa has become a staple in the academic discourse of Africa. It has become a ‘standard’ for the perception and representation of Africa, and of African thoughts and cultures.
This mistaken idea of Africa has become a liability. It encumbers and undermines efforts to foster skepticism, dispel superstitious beliefs, eradicate superstition-based abuses, and realise positive and progressive change. The Advocacy for Alleged Witches (AfAW) is an effort to correct this mistaken impression and deploy skeptical rationality in addressing issues and problems that affect Africa and Africans.
This advocacy group, founded in 2020, combats witch persecution and campaigns to end witch hunting in Africa by 2030. Witchcraft belief is a silent killer and eliminator of Africans. Witchcraft accusation is a form of death sentence. Alleged witches are attacked, banished or murdered. Alleged witches are buried alive, lynched or strangled to death in many parts of the region. The AfAW became necessary to fill in many gaps and supply missing links in the campaign and representation witch hunting in the region.
Western anthropologists have misrepresented and misinterpreted witchcraft and witch hunting in Africa. They created the impression that witch hunting was cultural to Africans; that witch persecution was useful, and that it fulfilled socioeconomic roles. Western scholars presented witchcraft in the west as a wild phenomenon and witchcraft in Africa as having domestic value and benefit. They explained witchcraft accusations and witch persecutions from the accuser, not from the accused’s perspective.
Incidentally, western NGOs drive and dominate ‘global’ efforts to address witch persecution in Africa. Witch hunting is not a problem in western societies, so western NGOs have waged a lacklustre campaign that merely papers over the problem. They do not treat the issue of witch persecution with the urgency that the issue deserves. On their part, African NGOs and activists have been complicit. They lack the political will and funding to challenge this sham, and have an ineffective approach to combating witchcraft accusation and witch hunting in Africa. Meanwhile, to end witch hunting, a paradigm shift is needed. The way that witchcraft belief or witch hunting is perceived and addressed must change.
AfAW exists to realise this shift and change. AfAW is an exercise in practical and applied skepticism. It deploys the canons of reason and compassion against witch hunting. AfAW engages in public education and enlightenment. It questions and debates witchcraft and ritual beliefs to dispel misconceptions too often used to justify abuses. AfAW tries to reorient and reason African witchcraft believers out of their illusions, delusions and superstitions. It foregrounds the skeptical Africa, which has too often been forgotten and ignored.
Abuses linked to witchcraft and ritual beliefs are pervasive in Africa because the region lacks a robust initiative to apply skeptical thought and rationality. To this end, AfAW uses the ‘informaction’ (from information and action) theory of change, because witch hunting persists in the region due to lack of information, or misinformation, and due to lack of action, inaction, or infraction.
At the global level, there is a lack of information about witch-hunting in Africa. Although a lot has been written and published on witchcraft in African societies, many people in Europe and America do not know about raging witch hunts in many parts of the region. The Advocacy for Alleged Witches works to fill this gap and correct the misrepresentation of witchcraft accusations in Africa. We campaign to draw attention to this imbalance in the perception of the phenomenon. But correct information is not enough. Balanced interpretation does not suffice. To combat witch persecution, information needs to be turned into action. Interpretations need to be translated into effective policies and interventions, hence the action aspect of the informaction theory.
On the action side, the Advocacy for Alleged Witches takes measures to address the problem because lack of adequate information has occasioned inaction or infractions. Wrong information has resulted in apathy and indifference towards witch hunting in Africa. Many international agencies are reluctant to act; they have refused to take action or to treat the issue with the urgency it deserves. With adequate and balanced information, international organisations would take appropriate actions.
At the local level, the Advocacy for Alleged Witches works to fill the information and action gaps. Many people accuse and engage in witch hunts due to a lack of information, or due to misinformation. Accusers are misinformed about the cause of illnesses, deaths, and other misfortune. Many people persecute witches because they have incorrect information about who or what is responsible for their problems, because they are not informed about what to do and where to go, who or what to blame for their misfortunes. Many people do not know what constitutes sufficient reason and causal explanations for their problems.
As part of the efforts to end witch-hunting, the AfAW highlights misinformation and disinformation about causes of misfortune, illness, death, accidents, poverty, and infertility, including the misinformation that charlatans and con artists, god men and women such as traditional priests, pastors, mallam and marabouts use to exploit poor ignorant folks. The AfAW provides evidence-based knowledge, explanation, and interpretation of misfortunes. It informs the public about the law and other existing mechanisms to address allegations of witchcraft. The AfAW sensitises the public and public institutions, including schools, colleges, and universities. It sponsors media programs, issues press releases, makes social media posts, and publishes articles and blogs on witch-hunting in the region.
The AfAW facilitates actions and interventions by state and nonstate agencies. The post-colonial African state is weak, so state agencies have limited powers and presence. The AfAW encourages institutional synergy to enhance efficiency and effectiveness. The AfAW petitions the police, the courts, and state human rights institutions. It pressures these agencies to act, collaborate and take appropriate measures to penalise witch-hunting activities in the region.
AfAW also intervenes to support individual victims of witch persecution. This intervention is based their needs and available resources. For instance, in situations where the victims survived and were not killed, AfAW works with relatives to take them to a safe location, support their medical treatment and facilitate access to justice. In situations where the alleged were murdered, the AfAW supports relatives of victims and ensures that the murderers are brought to justice.
As expected, AfAW gets more cases that it can handle and support. Due to limited resources we have not been able to intervene in all cases that have been reported to us. However in less than four years, the advocacy group has registered effective presence through its interventions in Nigeria and beyond.
With an informactional approach, the AfAW is deploying the canon of skeptical rationality to save lives, awaken Africans from their dogmatic and superstitious slumber and realise an African enlightenment that speaks to a specific problem and challenge.
What can our handwriting tell us about our personality? Graphologists assert that our rarely-used scrawl can improve mutual understanding in a marriage, help a recruiter to identify us as the right person for a job, or even reveal us to be a serial killer…
The trial in August 2023 of the serial killer Lucy Letby involved a number of handwritten notes that had been penned by the accused – and subsequently convicted – former neonatal nurse. Most UK readers will be aware of the post-it note Letby had written, which included the words “I AM EVIL” and “I DID THIS”, from the extensive media coverage of the trial proceedings.
Readers of the Mail Online, the Mirror and the Daily Star may also have read additional commentary on the handwritten notes found by police in Letby’s house, from leading British graphologist Tracey Trussell. After examination of Letby’s handwriting through these notes, Trussell spoke extensively to the Mail about Letby’s personality. Among other observations, she said that “Letby should never have been put in a position of care and responsibility” and noted that “Letby was likely to act impulsively and wilfully, without thought, and powerless to control strong subconscious urges. Plus, she lacked principles.”
I’m not trained in handwriting analysis, nor am I a member of the British Institute of Graphologists, but I think even I could tell you that a woman just convicted of seven baby murders and the attempted murder of seven more infants lacks principles, and should not have been in a position of care and responsibility.
Graphology is “the analysis of handwriting… to determine someone’s personality traits,” and it will not surprise the reader to learn that the British Psychological Society says that it has “zero validity”. It should be noted that graphology is distinct from forensic document examination, which seeks to use science to establish the authenticity or other questionable aspects of a document, including relating to the authorship and handwriting.
Graphology uses features like the size and spacing of letters, the angle of letters, the use of space and margins, the pressure applied with the writing instrument, the types of connections used in cursive, the downstrokes, and even how you cross your “t” to extrapolate personal traits from the handwriting sample alone.
There are claims that graphology has its origins back as far as ancient China, but the term itself was coined by a French priest and architect, Jean-Hippolyte Michon, in 1871. Michon believed that when people write spontaneously and without thinking that they bare their soul on the page, but later graphologists preferred Jungian and Freudian explanations and interpretations.
Even casting aside the existence – or otherwise – of the soul, there are some obvious reasons to be suspicious about the plausibility of graphology. Does one’s personality change when using a different writing implement? I can’t be the only person whose handwriting noticeable changes when using a nice ink pen rather than a biro. What about your education? Being born at a time and place where cursive (“joined-up”) writing was emphasised or ignored, or where left-handers were routinely forced to learn with their right hand will both clearly affect one’s handwriting, as will the age at which one leaves school.
It therefore comes as no surprise that when independently researched, graphology does not tend to hold up well. Graphology and personality: Another failure to validate graphological analysis (Furnham and Gunter, 1987) had 64 participants complete the Eysenck Personality Questionnaire (EPQ) and copy out a set text in their own handwriting. Using graphology texts, the handwriting was analysed and compared against the EPQ results, and “the results quite clearly demonstrated fewer significant effects than may be expected by chance.” This, the authors reported, concurred with many other studies into graphology – they quote four, from 1976 to 1986 – and they conclude with the following:
Perhaps one should be forced to conclude rather uncharacteristically for researchers that ‘no further work needs to be done in the field’?
Of course, graphology persisted and so inevitably further research has been done in the field, but subsequent studies have generally found very similar results. For example, Graphology and personality: an empirical study on validity of handwriting analysis (Dazzi and Pedrabissi, 2009) tested 101 students on the Big Five measures of personality and asked graphologists for their analysis of the same based on handwriting, with the following result:
Correlations between the Big Five Questionnaire and graphological evaluations did not confirm the capability of handwriting analysis to measure Big Five personality traits.
Despite the continued lack of good evidence for graphology, mainstream belief in this practice remains. As recently as 1991 it was used by 91% of French public bodies and private companies to assess prospective employees, and although its use in France is reported to be declining, there are reports of its use by recruiters in both the US and UK. It is hard to imagine astrology, which the British Psychological Society ranks alongside graphology, being used by any respectable employer to screen recruits. Why do professional, intelligent people believe in – and continue to use – such a method?
They highlight a 1992 meta-analysis of 200 graphology studies, which included some with methodological shortcomings, that found only a small effect size (r = .12) in inferring personality from handwriting. This effect size is:
not nearly large enough to be of any practical value and would certainly be too small to be perceptible to the human judge… even a small, real effect – for which the evidence is mixed at best – cannot account for the magnitude of handwriting-feature personality-trait relationships reported by graphologists or their clients.
King and Koehler also note that in studies, graphological prediction of job performance was “modest” when using autobiographical text which could give the graphologist contextual information, but that when the text used was identical for all the analysed writing, graphologists were unable “to draw valid inferences about job performance”. Essentially, without additional information, the measurable effect in these studies disappeared. Whether used consciously or not, information gleaned from a CV or a covering letter – or the knowledge that something was written by serial killers – seems likely to influence a graphologist’s analysis of a handwriting sample.
In any case, with an effect size ranging from modest with contextual information, to imperceptibly weak or non-existent without contextual information, it seems unlikely that actual effectiveness could be the most parsimonious explanation for some people’s persistent belief in graphology.
As I suggested earlier, it seems logical that many factors could influence handwriting, and King and Koehler highlight studies showing that one’s literacy, socioeconomic status and even gender can be predicted to some degree by handwriting, which they say “may in turn predict some personality traits. Thus, any weak ability of graphology to predict personality may be merely based on gender or socioeconomic status information assessed from handwriting.”
This may be one of the reasons that graphology can sometimes appear to have a weak or superficial predictive quality, but it is quite alarming that such a method is used for recruitment, as it would seem very likely to feed into discriminatory hiring practices. Indeed, when graphology first came to prominence phrenology and eugenics were used to justify legal and social discrimination, and around that same time graphology itself was suggested as a method to identify criminality and mental illness.
King and Koehler also note that the mean agreement of graphologists in handwriting interpretation is r = .42, which is not that much higher than non-graphologists’ interpretations, at r = .30. Their suggestion is that graphological interpretation of personality from handwriting is derived not from empirical evidence, but the same semantic inferences that anyone might make from handwriting – i.e. that small handwriting suggests modesty, that large suggests egotism, and that someone who precisely dots their i’s and crosses their t’s may be the kind of person who pays attention to every small detail in a task, because that’s literally what the phrase means in English.
…we found that naive judges “discovered” relationships in the data consistent with those claimed to exist by experts. The obvious implication is that semantic association, which appears to drive illusory correlation in both domains, is the origin of experts’ theories.
This illusory correlation potentially contributes to the continued use of graphology, as the graphological interpretation feels right and matches our own intuition as lay recipients of such analysis. All the more so if we, too, have read the analysed person’s job application – or indeed know that the person analysed is a convicted criminal.
The authors also note other explanations for continued use of graphology, such as Barnum statements, which could describe almost anyone. These also appear in the Mail Online article’s analysis of Letby: “Letby’s often reclining style of handwriting shows how she was withdrawn particularly when stressed, generally on the defensive and potentially capable of irreverent actions.” While not everyone is defensive, an awful lot of people become withdrawn when stressed, and literally everyone is potentially capable of irreverent actions.
As graphological interpretation isn’t generally legally acceptable, thankfully such analysis is restricted to post-hoc discussions rather than law courts. However, the continued use of graphology in recruitment is potentially far more worrying, not least due to the potential discrimination it introduces into such an important part of our lives.
“I’m addicted to placebos. I could quit, but it wouldn’t matter.” – Steven Wright
Placebo controls are a mainstay of clinical research in medicine. They are one of the gold standard features of the iconic “double-blind, randomised, placebo-controlled clinical trial.” This is surely an affirmation of the potency of the mighty placebo effect, right? Not really!
Even if placebo effects are a myth, placebo controls would remain a powerful tool to improve the quality of clinical trials.
The Rise and Fall of the Placebo Effect
A placebo is an intervention intentionally devised to be devoid of a relevant physiologic effect. The apparent over-achievement of placebo groups in some studies has created the impression of a potent therapeutic response to these intentionally impotent interventions. This has been given the moniker “placebo effect.” This enigmatic effect has garnered a mythology as a powerful inert intervention; a mysterious “black box” with unexpected power.
More careful studies and more critical analysis of prior data has taken much of the mystery and potency out of the placebo effect. These investigations have opened the black box and identified more mundane influences, biases, and statistical artifacts masquerading as the placebo effect. After proper attribution of these factors, the placebo effect mostly vanishes. To the extent that the placebo effect exists at all, its power has been greatly diminished.
Self-reported outcomes like pain and anxiety are vulnerable to influences that are difficult to measure, and these subjective responses remain the last hiding place for the placebo effect. Mike Hall and Dave Hahn have discussed the rise and fall of the powerful placebo narrative in previous Skeptic articles.
If the placebo effect is mostly imaginary, why are clinical investigators obsessed with using placebo controls? And if future research continues to neuter the placebo effect, will placebo controls be abandoned?
Placebos and clinical trials
The value of placebo-controls in clinical trials has little to do with the placebo effect.
Not every research question in medicine is appropriate for a placebo-controlled trial, but for investigating the safety and efficacy of an experimental medication, it remains a favoured study design
The value of a control group
Say, for example, we want to test the effectiveness of our new drug, humbly called “Panacea” for condition X. We find 1000 patients with condition X and treat them with Panacea. At the end of the study our measurements of condition X are unchanged. Can we conclude that Panacea is ineffective for condition X? Maybe, maybe not. What if condition X is a relentlessly progressive condition, something like Amyotrophic Lateral Sclerosis (ALS). No change might be a therapeutic victory. On the other hand, what if condition X is self-limited and usually resolves spontaneously, something like singultus (hiccups!). In this case, no change in the condition might be an indication that panacea is actually making the condition worse.
In order to figure out if a treatment is having a positive or negative effect, we need some reference for comparison, a so-called “control group.” There are many possible comparison groups we could imagine. The ideal control group would be identical to the treatment group. There is no perfect control group, but when possible and practical, using a random process to sort the experimental and control group is the best that can be achieved. This process maximises the likelihood that the groups will be matched in important factors such as: age, gender, severity of disease, co-morbidities, etc.
Here is how a randomised trial works. Each potential subject is assessed for eligibility according to a set of pre-defined criteria. After a process of informed consent, each eligible subject is then enrolled into the study. They agree to be in the study without knowledge of their treatment group. Only then is the subject randomly assigned to be in the treatment or control group.
The value of a placebo control
Now that we have sorted subjects into treatment and control groups, what does a placebo control add? It is desirable that the only difference between the treatment group and the control groups is the experimental treatment itself.
Randomisation ensures that the treatment and control groups are as similar as possible when they begin the study. Placebo controls ensure that the treatment and control groups are as similar as possible during the conduct of the study.
Implicit in placebo control is the assumption that the subjects do not know if they are receiving the experimental treatment or the placebo…they are blinded to their group assignment. To the extent possible the investigator(s) are usually blinded to the subject treatment assignment, as well. Placebo controls are a necessary feature for the blinding of subjects and investigators.
The argument for “blinding”
Imagine that you are the subject in a clinical trial of an experimental drug. As part of the informed consent process, you have been educated about the potential benefits and the potential risks of the study drug. Now imagine that you know you are in the treatment group. You might be more optimistic about your prognosis. You might be more enthusiastic about participating in the study. You might be more likely to comply with study activities. You also might be more vigilant about potential side effects.
Imagine that you know that you are in the control group. You might be more concerned that your condition is worsening. You may be more likely to seek treatments outside the study protocol. You might be more likely to drop out of the study. You might be less likely to report mundane life events as side effects.
Investigators are not immune to these types of biases. If an investigator is aware of who is in the experimental group and the control group, it could influence the way they interact with subject, the way they collect data, and in decisions they make in the conduct of the study. It also increases the possibility that they could accidently “unblind” the patient.
These potential asymmetries between the experimental and control groups are known as “bias,” and can confound the results of the research. Placebo controls and blinding are attempts to minimise bias in the design, conduct, and analysis of clinical trials. Minimising bias is one of the key features of the scientific method.
Conclusion
The value of placebo controls in clinical trials is not an affirmation of the power of the placebo effect. Even if the placebo effect is eventually proven irrelevant, placebo controls will remain a mighty tool to minimise bias in clinical trials.
As anyone who has been watching the news will have realised, for a lot of pupils, it hasn’t been the smoothest start to the new school year. Yet, crumbling classrooms and failing concrete aren’t the only health risks that our children are exposed to at their primaries and comprehensives, if a recent headline in the Guardian is anything to go by:
Thousands of schools serving meals that could contain cancer-causing chemicals
Education authorities across England and Wales shown to use meat that has been treated with either nitrites or nitrates
As the Guardian explains, Local Education Authorities have stated that “some or all of the schools in their area are using meat that has been treated with either nitrites or nitrates”. Typically, that’s likely to be bacon or ham, as nitrates and nitrites help give those meats their flavour and pink colouring. They also act as preservatives, slowing down the bacteria that cause food spoilage. Nitrates and nitrites are naturally occurring chemicals, and when it comes to pork products they’re often part of the curing process.
As the Guardian article continues, schools are using these treated meat products as part of school lunches, even though there is “evidence that both chemicals … can be carcinogenic”. The Guardian also mentions that some scientists and politicians are calling for nitrites and nitrates to be banned from use in meat production. It’s clear that we are meant to be very concerned about the thousands of schools serving up cancer-causing chemicals to our children, or at least to the children not actively dodging falling concrete.
‘Too much’ nitrite-cured meat brings clear risk of cancer, say scientists
A leading scientist has urged ministers to ban the use of nitrites in food after research highlighted the “clear” risk of developing cancer from eating processed meat such as bacon and ham too often.
The study by scientists from Queen’s University Belfast found that mice fed a diet of processed meat containing the chemicals developed 75% more cancerous tumours in the duodenum than mice fed nitrite-free pork.
It also found that mice fed nitrite-cured pork developed 82% more tumours in the colon than the control group.
This is an animal model, in which researchers took 40 Adenomatous Polyposis Coli (APC) Multiple Intestinal Neoplasia (min) mice – these are mice that are highly prone to developing tumours, making them handy to research what causes tumours to develop or not.
The researchers split the 40 mice into four groups, each of which got unrestricted access to foods, aligning to one of four different diets: nine mice were given a diet containing unprocessed nitrite-free pork, ten were given a diet of nitrite-free sausage, ten were given a diet of nitrite-containing frankfurter, and the remaining nine were given a control diet of AIN76 – a special kind of rodent chow that is used in research. The paper doesn’t explain what happened to the two missing mice, but we can assume that isn’t important.
In each of the meaty diets, the mice had unrestricted access to food pellets consisting of 15% of their specific meat, and 85% of the basic chow. So, in summary, 28 of the mice received various nitrite-free diets, and 10 got the nitrite-containing Frankenfurter.
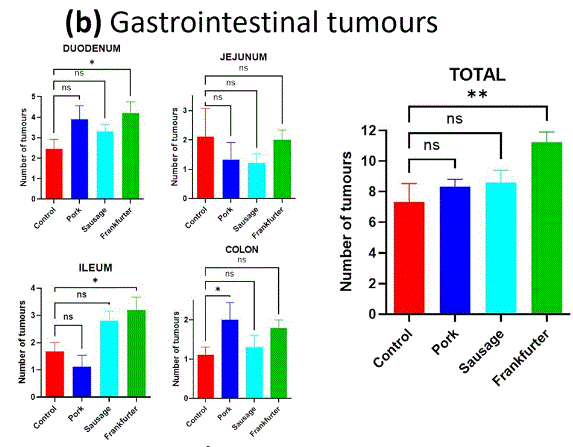
After 8 weeks, the researchers culled and dissected the mice, to see how many tumours each had developed, in either the duodenum, jejunum, ileum or colon. What they found was, on average, the nitrite free pork and nitrite free sausage mice developed around 8 tumours each, while the nitrite-rich frankfurter mice developed around 11 tumours each. The control mice had an average of 7 tumours each – because, after all, these were mice selected especially for their propensity to develop tumours. In fact, in the Jenunum, the control mice developed more tumours than any of the other mice, and in the colon, it was the nitrite-free pork that correlated with the most tumours – neither of which were statistically significant findings.
Of all the various analyses that were undertaken, the only significant finding here was that, compared to control, the nitrite-processed frankfurter mice developed a statistically significant number of additional tumours. The pork and sausage mice did not develop a statistically significant number of additional tumours above control.
In the discussion, the authors conclude:
This study found that a modest inclusion of a sodium-nitrite-containing pork frankfurter in the diet of APCmin mice significantly increased the number of intestinal tumours present. A similar inclusion of either nitrite-free pork sausage or minced pork did not increase tumour numbers.
It was this finding in particular that inspired the headlines in the Guardian and elsewhere, about the cancer-causing chemicals in your children’s foods. To reiterate, that scary headline is based on a study in which ten nitrite-fed mice who were prone to developing intestinal tumours developed more intestinal tumours than tumour-prone mice fed on a non-nitrite diet.
This might be a robust study, with a reliable finding, even despite the multiple analyses conducted. However, this finding is based on 10 mice, out of a total of 38 mice, all of which were already prone to developing tumours. It might prove to be a useful starting point, but it’s not sufficient yet to justify alarmism over diets in schools.
What’s more, that discussion might be making a claim that is not entirely supported, in that it described the Frankenfurter diet as “modest inclusion” of sodium-nitrite-containing pork frankfurter. The “modest inclusion” amounted to 15% of the mice’s diet, supplemented with 85% of other feed. Would we otherwise consider 15% of dietary intake a “modest” amount of processed meat? Would we expect cured sausages and bacon to make up 15% of food intake per day, every day? That seems like an unusual amount of processed meat.
On that subject, it is worth revisiting the WHO labelling issue, where the WHO moved processed meat into the Group 1 carcinogen category. Group 1 are the things that are known carcinogens to humans, and there are 127 things in that list, compared to 95 things that are Group 2A “probably carcinogenic”, and 323 in Group 2B “possibly carcinogenic”. In 2018, processed meats were moved into group 1. But just because something is a cancer risk, that doesn’t mean it’s something we should be scared about, depending on the risk level.
Helpfully, the WHO do actually quantify that risk for us:
The consumption of processed meat was associated with small increases in the risk of cancer in the studies reviewed. In those studies, the risk generally increased with the amount of meat consumed. An analysis of data from 10 studies estimated that every 50 gram portion of processed meat eaten daily increases the risk of colorectal cancer by about 18%.
Coincidentally, 50 grams is about the size of a Vienna Frankfurter, at least according to the Sausage Sizes Guide on the website sausageman.co.uk. So, if we are to listen to the WHO’s own data, and if we are to take the sausage man at his word, then someone would have to eat an additional Vienna Frankfurter every day in order to raise their risk of colorectal cancer by just less than a fifth.
The current lifetime risk for colorectal cancer in the UK is about 5%, according to cancer.net – therefore, if you eat a regular diet, with a regular amount of processed meat, and then you add a daily additional smoked sausage to your diet, your lifetime risk would rise from 5% to 6%.
The question we should be asking, then, is how many sausages are schools giving our children, and at what frequency. And, more generally, what percentage of our kids’ daily diet is made up of nitrite-processed meat. We also should not panic just yet, because so far the claims around the harm of nitrite-processed meats are only in mice – but we should avoid excess until there’s better data out there.
On the subject of data, there’s one final coda to this story. There’s a reason that this story came out at the start of September, with the scary headline about “Thousands of schools serving meals that could contain cancer-causing chemicals”. The schools did not announce this as part of a statement about new school menus for the year ahead – the story came from LEAs responding to freedom of information requests about the nitrite content of their school meals. The source of that FOI is named in the Guardian’s coverage:
The FoI exercise was undertaken by Finnebrogue, a Northern Irish food firm that launched the UK’s first brand of nitrite-free bacon – Better Naked – in 2018.
Jago Pearson, the company’s chief strategy officer, said it welcomed other food producers, including Waitrose, Morrisons and Marks & Spencer, introducing similar products “because this can only help improve the health of the nation”.
This, therefore, is a story about how your child’s school meals contain carcinogenic chemicals that you should be scared of… yet, it is arguably a tool for a nitrite-free meat manufacturer to get some eye-catching headlines to endorse the primary selling point of their product. Meanwhile the story may scare readers over what amounts to indicative early research in a small number of tumour prone mice who were fed an unusual amount of nitrite-heavy food.
It may well turn out, in time, that nitrite in processed meats are bad for us, and raise our cancer risk from 5% to 6%. Or it might turn out to be one of those “in mice” findings that don’t pan out when it comes to data in humans.
In either case, school dinners are not currently the biggest threat to the health and wellbeing of children at school in the UK, and parents have enough to worry about without also panicking about the contents of that relatively rare smoked sausage.