


I am going to preface this article with some pretty heavy caveats. If you’re not interested in reading all the reasons I might not be the best person to review the paper I’m going to try and review, please skip to the next subheading.
Firstly, I don’t understand a thing about machine learning. I do not know what its strengths or limitations are, and I haven’t the first clue on how to judge when and where the use of machine learning may or may not be appropriate. I am a luddite at heart and, despite growing up in the 90’s and 00’s, I am perpetually baffled by modern technology. I’m fairly certain most stuff happens by literal magic, and we’re all too frightened to admit that none of us understand the explanations of how the internet, digital photographs or microwaves work, because we think everyone else “gets it”.
I know embarrassingly little about Neuroscience. Although my undergraduate degree was dual honours BSc Neuroscience and Psychology, all I can really remember about neuroscience is that it is really hard because brains are extremely complicated, mysterious and all round wacky little organs.
I also have no idea how to read an MRI, an fMRI or the results of any other brain scan. The images they produce are pretty, and hearing someone confidently explain what the funky colours on the spinning 3D image of a brain probably mean is extremely compelling and I want to understand, but alas, these talks leave me with little other than a renewed interest in geology. You know where you are with a rock.
It’s also important to remember that while I do have a PhD in psychology, like all PhDs it is in a super-specific topic. I might write an article about it one day, when I am able to contemplate my thesis without experiencing a degree of panic that makes me wonder whether my tongue is swelling or if my head is shrinking. But suffice to say, I am not an expert in neurodiversity, mental health or anything that a university syllabus would give the unfriendly title of “abnormal psychology”.
Oh, and finally, a declaration of a conflict of interests, or perhaps a cause of motivated reasoning: last year I was diagnosed with ADHD, and since getting that diagnosis a lot of stuff has started to make sense. I’m pretty attached to my diagnosis; I feel like I understand myself a little more and feel better equipped to start taming my own personal chaos.
So, with that brief list of the most obvious reasons why I am utterly unqualified to review a paper which uses MRI scans and computer learning to examine whether Attention Deficit Hyperactivity Disorder (ADHD), Autism Spectrum Disorder (ASD), and Obsessive-Compulsive Disorder (OCD) should be considered as three distinct categories of neurodiversity out of the way, let’s get to the review!
TLDR; I’m not really qualified to examine this paper, but I’m going to anyway.
Examining overlap and homogeneity in ASD, ADHD and OCD
A few months ago I stumbled across a twitter thread discussing the findings of a paper titled Examining overlap and homogeneity in ASD, ADHD and OCD: a data driven, diagnostic-agnostic approach, by Kushki et al. 2019. Combing through the thread, which excitedly described the research, some of the reported findings of the paper didn’t sound right. The overall message seemed to be that this paper had good evidence to suggest that ASD, ADHD and OCD are not separate conditions, but are just different points on a long continuum of neurodiversity, and therefore these diagnostic labels may not be valid. This is not the first paper to raise these questions, indeed there is ongoing debate over the diagnosis of various neurodevelopmental and behavioural conditions, and a not insubstantial number of researchers argue that Autistic Spectrum Disorder and Attention Deficit Hyperactivity Disorder should be thought of as different points on the same spectrum. The paper by Kushki et al adds to this existing literature, but is unusual in including OCD.
The thread alerting me to this research gives an excellent summary of the paper by Kushki et al. The tweeter didn’t jump to any conclusions or wildly extrapolate from what was said in the original paper. In fact, to my mind, they have done an excellent job of picking out key points in the paper, summarising them accurately, and sharing them in an accessible way.
However, I am skeptical of the argument that ADHD and ASD are different presentations of the same condition for several reasons, not least of which is that people with ADHD and ASD (and OCD for that matter) appear to require different forms of support and respond differently to the same medications. But the twitter thread and many of the replies seemed to indicate that there was something special about the paper by Kushki et al, and that it dealt a killer blow to the idea that ADHD, ASD and even OCD are different conditions. Unsure whether something had been lost in translation from paper to twitter thread, or if the research was indeed a scientific coup de grâce, I looked at the original paper to see for myself.
The study described by Kushki et al uses brain scans and machine learning to investigate whether individuals diagnosed with ADHD, ASD and OCD have different neuroanatomy from each other, and from individuals who appear to be neurotypical. Unfortunately, I think the paper suffers from some important flaws.
The participant pool is questionable, and brains are weird
The paper claims to take a “diagnostic agnostic” approach to investigating the cortical thickness in the brains of 226 children between the ages of 6 and 18. Of these 226 children, 112 had a pre-existing primary diagnosis of ASD, 58 had a pre-existing primary diagnosis of ADHD, 24 had a pre-existing primary diagnosis of OCD, and 22 of the children had no pre-existing diagnosis and were used as “typically developing controls”.
This is quite a small sample, once you look into how the different groups break down. Most research using an MRI scanner is likely to have a small sample size, because an MRI is a very expensive bit of kit and is expensive to use. This is par for the course, but what does strike me as a problem is the large disparity in the numbers between groups. Again, this is not an insurmountable problem, as there are many statistical tests that can compensate for variations in sample sizes between research groups, but it did cause me to raise my right eyebrow in a quizzical fashion.
The age range also struck me as very odd: between the ages of 6 and 18, people – and their brains – change an awful lot. Like I said, I am absolutely not an expert, but I’m not convinced it is possible to draw good conclusions about the relationship between cortical thickness and neurodevelopmental categories in children when you are looking at brains in people with such a large age range.
The relationship between brain anatomy and behaviour is rarely simple, but for illustrative purposes, let’s imagine that it was. Imagine that there is a hypothetical area of the brain responsible for controlling how much a person likes bread – we can call this area the Nucleus of Crumb Buns. Now let us imagine that individuals who report absolutely loving bread reliably have a much larger Nucleus of Crumb Buns than individuals who are bread ambivalent. Brains change so much that measuring the Nucleus of Crumb Buns in a six year old might not be predictive of the individual’s love of bread, or the size of their Nucleus of Crumb Buns at eighteen.
But the relationship between structure, function and location is not that simple in humans, and it is rarely possible to determine a clear relationship between location, structure, function and ultimately emotions, cognition, and behaviour. Brains are tricky little things. For example, generally, the language centres of the human brain are located in the left hemisphere, but when an individual loses their language ability due to a stroke in the left hemisphere of the brain, during recovery it is not uncommon for analogous locations in the right hemisphere to start taking on the jobs that are usually done in the left hemisphere. Brains change, and under some circumstances, they can change a lot.
The behavioural measures are lacking
All participants underwent a series of behavioural measures: the Social Communication Questionnaire (SCQ) which measures just one highly variable aspect of autism; the inattention subscale of the Strengths and Weaknesses of ADHD-symptoms and normal behaviour rating scale (SWAN) – so not the whole SWAN, just one subscale measuring just one feature of ADHD; and the Toronto Obsessive Compulsive Scale (TOCS). Participants also completed the child behavioural checklist (CBCL) and an “age-appropriate IQ test”.
To my mind, it seems very simplistic to use only one measure that can be indicative of ASD, and only one measure that is indicative of ADHD. Firstly, both ADHD and ASD are incredibly heterogenous. Some people with a diagnosis of ASD have relatively little difficulty in navigating social interactions, whereas others do struggle and find social interactions extremely stressful. Inattentiveness is common among people with a diagnosis of ADHD, but for some this is not their primary symptom, whereas for others, their inattentiveness is the bane of their lives.
Measuring such complex disorders with single behavioural measures is, in my opinion, overly simplistic. At this point, the researchers are not measuring disorders, they are measuring some symptoms which we know are neither ubiquitous nor unique to the disorders the researchers claim they are indicative of.
Furthermore, these measures are filled out not by the individual who may have OCD, ADHD or ASD, but by clinicians, based on conversations with the child and/or their parents, or based on clinician observations. This approach of course has its uses, but it does create opportunities for misinterpretation – for example, from the outside, self-stimulation (stimming) behaviour can look very similar to obsessive compulsive behaviour, but the internal cognition behind these two things are different.
Brain images and debatable results
To explain in simplified terms, the physiological brain data was collected via brain scans of participants in one of two hospitals (one in Toronto, the other in Montreal). The images were processed using a series of analysis tools and procedures resulting in measures of cortical thickness in 76 regions of the brain of each participant. A regression analysis was used to measure the likely influence of age, sex, and hospital (to control for the influence the different machines might have on the images) on cortical measurements. This data and the data from the behavioural measures was pumped into a machine to do its clever machine learning thing resulting in data clusters. These data clusters are groups where more similar data points collect together to make one cluster, and more dissimilar data points make different clusters.
This process in this study resulted in 14 clusters based on neuroanatomy. These clusters were then analysed to see which participant (and therefore which primary diagnosis) fell into which cluster, allowing the researchers to see if each cluster had only individuals with one diagnosis in, or if some clusters were populated by individuals with different diagnoses.
Through all of this data and computer magic, the researchers have produced a bunch of statistics, and some interesting data visualisation and infographics. Some of it is funky with lots of nice colours representing all the different clusters, but a lot of it is also just confusing and hard to interpret. For now, lets ignore the pretty colours and look at the basic statistics. The participants in each diagnostic group had significantly higher scores on the questionnaires that measure the primary symptom of each group, meaning participants in the ASD category had the highest scores in the SCQ, the questionnaire designed to measure social difficulties. Participants with OCD had the highest scores in the questionaries used to measure OCD. ADHD participants had the highest levels of inattentiveness. Basically, this very unsurprising result shows us that participants who have been diagnosed with condition A had very high scores on the questionnaire frequently used to help diagnose condition A.
The more interesting findings are that 46% of participants with a diagnosis of ASD also met the clinical cut off on the SWAN (indicative of ADHD), and 40% of those with an ASD diagnosis met the clinical cut off for the OCD measure. 11% of participants with a diagnosis of ADHD met the clinical cut off on the SCQ measure (indicative of ASD), 17% of participants with an ADHD diagnosis met the clinical cut off on the OCD measure. 8% of participants with an OCD diagnosis met the clinical cut off for the measure indicative of ASD, and 24% of the participants with an OCD diagnosis reached the clinical cut off on the SWAN, which is indicative of ADHD. And finally, of the 22 typically developing controls, none of them met the clinical cut off on the measures indicative of ADHD or ASD, but 2 of them did exceed the clinical cut off on the OCD measure. Or, to put it another way, two of the individuals who were in the typically developing category may well have had undiagnosed OCD.
So, what to make of this set of results? Does the finding that many of the participants with one diagnosis had clinically significant symptoms of other conditions mean that all these conditions are just different points on one big continuum as the authors seem to be arguing, or does it just provide further support for the often reported finding that people with one neurodevelopmental condition often also have another, because ADHD, ASD and OCD are not mutually exclusive conditions. I rather think it is the latter.
In fact, it is well documented that ADHD and ASD often co-present. Research looking into these conditions have found that anywhere between 20-80% of children diagnosed with ASD also meet the diagnostic criteria for ADHD, while between 30-50% of children with a diagnosis of ADHD also meet the diagnostic criteria for ASD. In this paper by Kushki et al, only the participants’ primary diagnosis is taken into account, it is entirely possible that many of the participants had more than one of the conditions mentioned, and it is not clear if participants with a dual diagnosis were excluded.
Furthermore, even if all participants only had one diagnosis (apart from the 22 controls who had no diagnosis), it doesn’t necessarily mean they only had one condition, and, as this study itself beautifully illustrates with the two typically developing controls who were found to meet the diagnostic criteria for OCD, sometimes people are not diagnosed with conditions because no one has realised the condition is there until the individual is tested for it.
There is also the problem that some of the symptoms of these disorders can look similar from the outside but have completely different causes. Take for example the finding that people with ADHD and people with ASD often find social interactions difficult: whether the causes of these similar difficulties are the same isn’t always clear. Growing up as a neurodiverse person surrounded by neurotypical people can mean that you are different, you interact differently to the other people, you notice you are a bit different, other people notice you are a bit different, and other people treat you differently to how they treat other people around you. This in itself could cause social problems, not because the condition causes social problems, but because the treatment you repeatedly receive from others could cause social anxiety if that treatment is negative.
Alternatively, similar outward symptoms or habits, such as having difficulty following conversations, can have different internal cognitive causes, for example, one person may have difficulty socialising because they can’t read between the lines of what people are saying and take everything at face value, while others may have difficulty socialising because they can’t pay attention when others are talking, so they lose the thread of a conversation and misunderstand what’s going on because they zoned out for a bit.
The data visualisations are strange
The authors clearly went to a lot of time and effort to create bar graphs and scatter plots and brain images in many fun colours, so I guess it would be rude of me to ignore it all, so let’s look at one of the more penetrable data visualisations. There is a lovely bar graph showing what percentage of participants from each diagnostic category (either OCD, ADHD, ASD or typically developing) ended up in which cluster, from clusters 1 to 10. This is a tad confusing, as earlier in the paper we are dealing with 14 clusters, but in this graph there are only 10, and later there is a diagram showing clusters 1 to 10 but cluster 5 has been removed because it was a poorly defined cluster. This in itself makes me wonder how exacting these clusters are if they can be reduced from 14, to 10, to 9 for no clear reason. I can’t help but wonder if the number of clusters the researchers use in their analysis is somewhat arbitrary, or at least the result of a judgement call on the part of the researchers, not a strict number dictated by the results of cold hard algorithms created by machine learning.
On this graph there is a yellow bar on the left-hand side representing the number of typically developing participants the machine learning tool put into cluster one. The yellow bar indicates around 36% of 22 people i.e., 7.98 people who are categorised as typically developing have been sorted into cluster one.
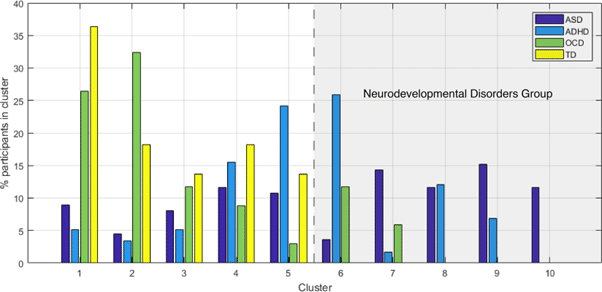
Over on the far right, representing cluster 10 are around 12% of the 112 participants with a diagnosis of ASD, and no one else. No one else is in cluster 10, just 14.64 children with a diagnosis of ASD . Clusters 8 and 9 are populated only by children diagnosed with ASD or ADHD. In clusters 1-7 there are children with OCD, and neurotypical kids are only found in clusters 1-5. There are ADHD kids in every cluster except for 10, and there are ASD kids in every single cluster Between the cluster groups, the slightly odd percentages, the presence of a dotted line designating half the graph as the neurodevelopmental disorders group (even though there are children diagnosed with a neurodevelopmental disorder in the half of the graph that isn’t labelled as the developmental disorders group), it is difficult to determine exactly what conclusions one is supposed to draw from this graph, even at very close inspection.
There is also a funky looking matrix, where SCQ (the “autism measure”) scores run along the X axis, and SWAN (the “ADHD measure”) scores run along the Y axis. The body of this matrix is populated by presumably 266 different data points that are in one of 9 colours (each colour representing cluster 1-10, although cluster 5 has been removed because it was too poorly defined) and are one of four different shapes (each shape representing either participants with a diagnosis of OCD, ASD, ADHD, or participants classed as typically developing participants).
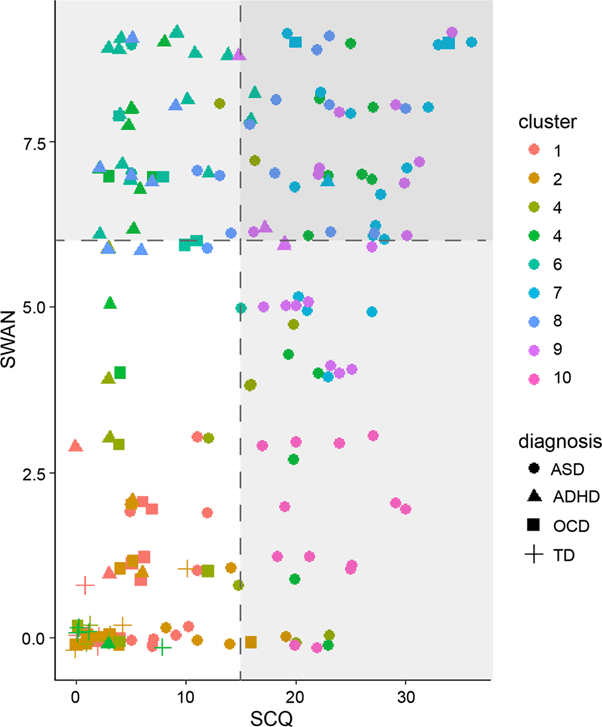
It’s a real doozy of an image. Some of the data points are so close together they almost merge into a blob. I think the impression that one is supposed to get from this image is that the various diagnostic labels are meaningless, because there are different shapes and different colours all over the place, but if you look closely, all of the typically developing controls are exclusively in the bottom left quadrant, with low scores on the SCQ and SWAN. The left half of the matrix and the top right quadrant has participants with a primary diagnosis of ADHD, ASD or OCD, and in the bottom right quadrant, with high scores on the SCQ and subclinical scores on SWAN you see nothing but round symbols representing those with a diagnosis of ASD, and one solitary square point, representing one participant with OCD, who appears to have very low score on the SWAN but has a SCQ score that just crosses the line into being clinically significant.
Sure, this matrix does not show kids with a diagnosis of ADHD, OCD or ASD all sitting nicely in their own little boxes with absolutely no overlap, but to me, this matrix doesn’t look like meaningless noise either. To me this looks like a visualisation of the extent to which different categories of neurodivergence often share symptomology, and that more than one flavour of neurodivergence can co-occour in one patient simultaneously.
Conclusions
This paper is not a deathblow to the idea that ADHD, ASD and OCD are separate conditions; if anything, the message I take from this paper is that people with one diagnosis are highly likely to have symptoms of other conditions and often this reaches clinical significance indicating that the individual does indeed have two or more conditions simultaneously. That said, there are plenty of other papers looking at whether ADHD and ASD really are separate conditions, or if they are better thought of as different aspects of the same condition expressing itself differently in different people.
It’s an interesting question that I am sure will keep many researchers very busy for years to come, and it is entirely possible that as research continues I will be proven wrong and will have to reassess my position. That said, despite the excitement I have seen expressed about this specific paper, I’d strongly argue that this paper is not an irrefutable bit of killer evidence that undeniably supports the hypothesis ADHD and ASD are the same thing.
Ultimately, what this paper does do is further illustrate several things. One, that humans are incredibly complicated. Two, that neurodiverse people can be extremely different from each other; just as no two neurotypical people are exactly the same, no two autistic people are the same, no two ADHD people are the same, and no two people with OCD are the same. Three, that brains are extraordinarily complicated, and drawing a neat line from brain structure to human behaviour is fraught with difficulty. Four, that the statistical analysis and the interpretation of data involved in studying human brains and behaviour is incredibly difficult. And five, that maybe, just maybe, I’d have fewer grey hairs if I had decided to do geology.