


The association between violent media and aggression in adolescents is “nearly as strong as the association between cigarette smoking and lung cancer”. So said the American Academy of Pediatrics in 2009. The American Academy of Family Physicians made the same claim in a position statement that’s still on their website today. It can also be found in current psychology textbooks, and in opinion pieces by doctors and politicians as recently as 2025. The origin of this assertion is rarely cited, and almost never questioned.
Some sources add a few other supposedly well-established health-based correlations into the mix, such as the effect of lead exposure on childhood IQ scores, or the link between calcium intake and bone mass. Fortunately, this makes it easy to track down the paper where these claims first appeared – Media Violence and the American Public (2001) by Brad J Bushman and Craig A Anderson, which contained the following chart:
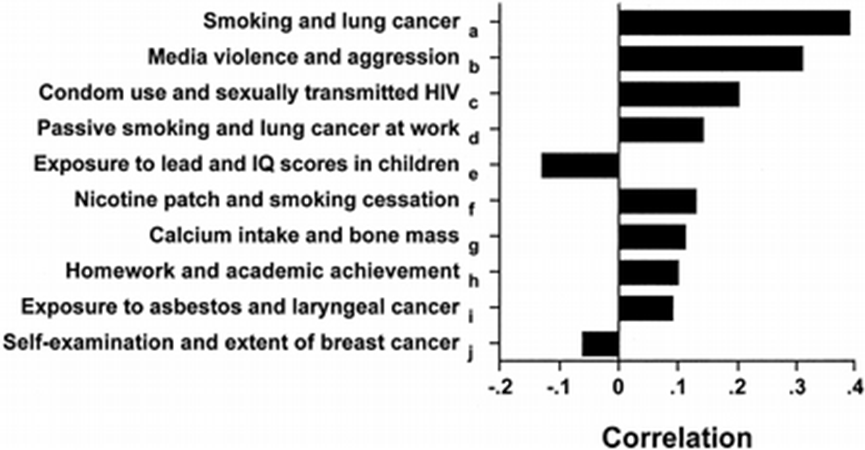
The point the researchers are trying to make with these comparisons is unambiguously stated in the paper:
Most people would agree that the other correlations displayed in [the chart] are so strong that they are obvious. For example, most people would not question the assertion that taking calcium increases bone mass or that wearing a condom decreases the risk of contracting HIV, the virus that causes AIDS. Why, then, do some individuals question the assertion that viewing violence increases aggression?
To assess the chart, we first need to understand what the numbers on the x-axis represent. These are Pearson correlation coefficients, which are denoted by r. According to the British Medical Journal, r = 0-0.19 is regarded as a very weak association, 0.2-0.39 as weak, 0.40-0.59 as moderate, 0.6-0.79 as strong, and 0.8-1 as very strong correlation.

The smoking and lung cancer figure, commonly cited as comparable to the link between media violence and aggression, is an r value of around 0.4. According to the paper, that comes from a study conducted in 1950 – literally the first significant study examining the link between smoking and lung cancer, from before modern causal inference methods, before large-scale longitudinal research, and before anyone had established the biological mechanism by which tobacco causes cancer.
A 2025 paper in the journal Translational Lung Cancer Research puts the current best estimate at r = 0.753. The same study puts the passive smoking link at around r = 0.42, almost three times as high as the chart suggests. Of course, Bushman and Anderson didn’t have access to this information in 2001, but they did have five decades of more robust research available – and instead they used a small estimate, from the oldest possible study, and set it as the bar the media effects research needed to clear.

The media violence and aggression figure actually comes from a 1994 meta-analysis looking at TV violence and anti-social behaviour. The r value of 0.31 was, as far as I can find, the highest estimate of any media effects research to date. Bushman and Anderson’s own 2001 meta-analysis on violent video games and aggression only reached r = 0.19. That’s “very weak”, according to the BMJ.
The rest of the table doesn’t hold up much better under scrutiny. I won’t go into all of the entries, but remember that they’re being used as examples of correlations most people would agree are “so strong that they are obvious”. In some cases, the issue is simply that those purportedly common public assumptions are wrong. For example, breast self-examination as a predictor of early cancer detection has such weak evidence behind it that many health bodies have stopped recommending it, while the link between asbestos and laryngeal cancer specifically – as opposed to other diseases asbestos is strongly associated with – is contested. A 2016 systematic review of 15 studies found that 10 of the 15 showed no correlation, and those that did rarely controlled for tobacco and alcohol use.
As for some of the other entries in the list, it’s hard to describe the figures as anything other than misleading. The calcium and bone mass figure (r ≈ 0.11) was rather strangely taken from a meta-analysis that specifically looked at people over the age of 18 – an age when we’ve already gained 90% of our peak bone mass. Studies available at the time showed the figure in five-year-olds is around r = 0.25. The homework figure cited an entire book as its source, and I tracked down the claimed r = 0.1 figure in a section describing the variation by school subject:
Mathematics produced the strongest correlation, r = +.22. Reading, r = +.20, English, r = +.20, and correlations based on multiple subjects, r = +.19, produced slightly smaller estimates that all fell with the 95% confidence range of one another. Science, r = +.13, and social studies, r = +.10, produced the smallest correlations.
The researchers cherry-picked the subgroup with the smallest correlation coefficient and claimed it represented the link between homework and academic achievement. The same book recounts studies showing correlations as high as r = 0.52.
But the numbers only tell part of the story. There’s a more fundamental problem with the smoking comparison, which would persist even if every figure in the table were accurate: the two sides aren’t measuring equivalent things. Lung cancer is a specific clinical diagnosis, applied consistently by trained clinicians. Cigarette consumption can be counted in cigarettes per day over years. The relationship between the two has been tracked in large prospective studies over decades, and the causal mechanism is understood in detail. When you report a correlation between smoking and lung cancer, there’s very little ambiguity about what either variable means.

The media effects literature doesn’t have that clarity on either side. “Violent media” is a category with genuinely contested edges. Studies have used different and often incompatible classification systems, and regularly disagree on how to code the same titles. One 2019 Oxford video game study, for example, used PEGI (Pan European Game Information) content labels as their criteria. The popular LEGO video games (e.g. LEGO Star Wars), which tend to be rated 7+, almost all carry the PEGI “Violence” label.
“Aggression” is harder still. Real violence is rare enough that it’s almost impossible, not to mention unethical, to study directly in a controlled setting, so researchers use proxies: how much hot sauce someone gives a stranger; how long a noise blast they direct at another participant; how many pins they stick into a voodoo doll; scores on a questionnaire filled in immediately after watching or playing; or even physical responses associated with emotional arousal like heart rate, or sweating. The vast majority measure immediate responses in artificial settings, with no follow-up to see whether any effect persists beyond a few minutes, and the relation of any of these measures to actual aggression is questionable at best, let alone the possibility that a person might commit violence in the real world.
Longitudinal media effects studies, which measure effects over years, are very hard to control for other factors, and basically impossible to solve for the direction of causation. If a correlation were shown, who’s to say whether it’s due to aggressive people choosing violent media rather than the other way round? The relationship between smoking and lung cancer does not have the same problem.
The smoking comparison may not be as ubiquitous as it was a decade ago, but it still lingers in the background of the debate, quietly shaping how some people think about the evidence. If we look closely, we can see it is little more than a rhetorical sleight of hand, comparing epidemiology with social science, cherry-picking both, and hoping the authority carries across. At the very least, it’s a reminder that if a claim sounds as solid as “smoking causes cancer,” the evidence it is built on needs to be just as solid, too.